Class, Homeownership, and Support for Clean Energy Policy
Evidence from the 2024 Cooperative Election Study
Motivation and Question
Public support for clean energy and environmental regulation is often described in ideological or partisan terms. While political orientation is clearly central, less attention has been paid to how material position—particularly housing tenure—may independently structure climate policy attitudes.
This brief asks a simple question:
Does homeownership predict support for clean energy policy net of party, ideology, and income?
Using nationally representative survey data from the 2024 Cooperative Election Study (CES), I show that homeownership is associated with lower support for clean energy policies even after accounting for political orientation and standard socioeconomic controls. This pattern suggests that climate attitudes may reflect not only ideology, but also individuals’ positions within housing and asset structures that shape exposure to regulation and perceived costs.
Data and Variables
The analysis uses the 2024 CES Common Content, weighted to approximate national representativeness. After listwise deletion on key variables, the analytic sample includes approximately 56,000 respondents.
The primary outcome is clean_energy_support, a composite index capturing support for environmental and clean energy policies. The index is constructed as the mean of multiple binary items, including support for:
EPA regulation of carbon dioxide emissions
Renewable electricity generation requirements
Strengthened enforcement of the Clean Air and Clean Water Acts
Restrictions on fossil fuel expansion and new oil and gas leases
The index ranges from 0 to 1, where higher values indicate stronger overall support for clean energy and environmental regulation. Using an index rather than a single item provides a more stable measure of underlying policy orientation.
Descriptive Patterns: Income, Homeownership, and Clean Energy Support
Figure 1 presents weighted mean levels of clean energy support by income group and homeownership status:
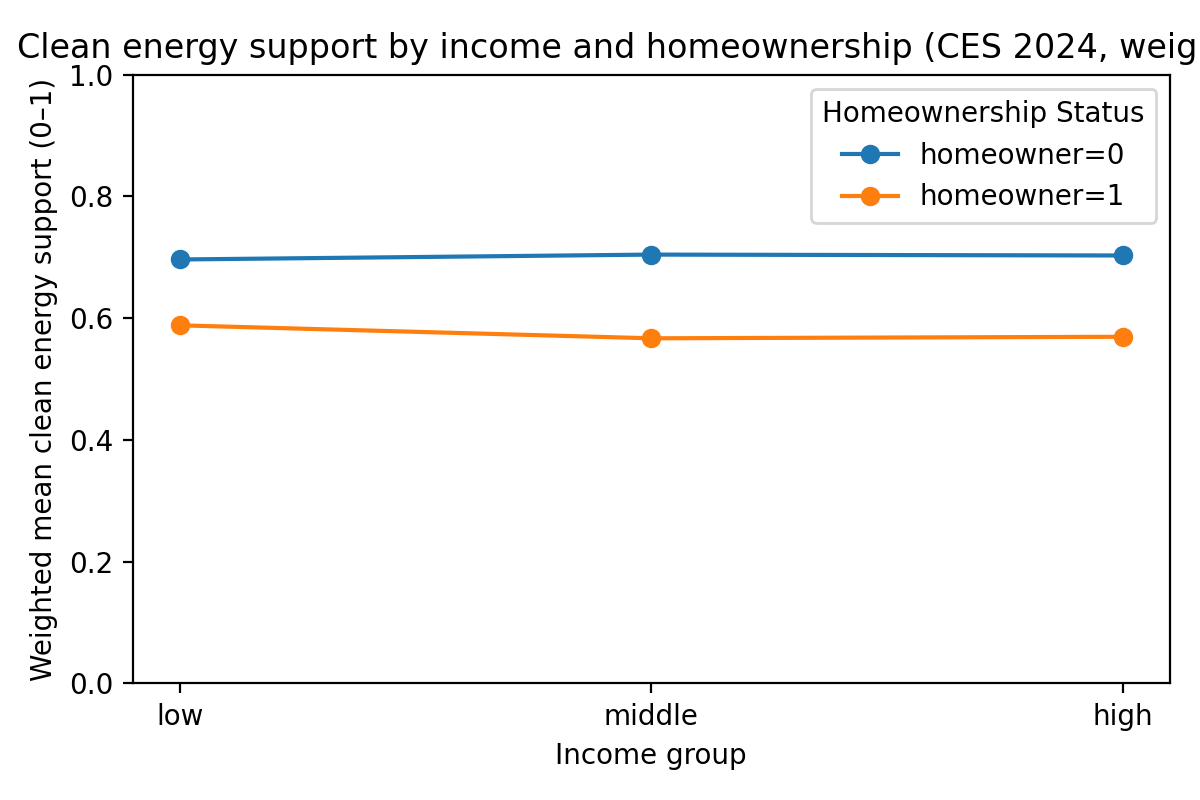
Two patterns are clear:
Renters exhibit consistently higher support for clean energy policies than homeowners, across all income groups.
Income differences within tenure groups are relatively small, especially among renters.
Among renters, support for clean energy policies is high (approximately 0.70 on a 0–1 scale) regardless of income. Among homeowners, support is substantially lower (roughly 0.57–0.59), again with little variation by income.
These patterns suggest that housing tenure may be more strongly associated with climate attitudes than income alone, motivating multivariate analysis.
Weighted OLS Results: Does Homeownership Matter Net of Politics?
To assess whether the observed tenure gap reflects political sorting, I estimate a weighted least squares (WLS) regression of clean energy support on:
Party identification
Political ideology
Income group
Education level
Homeownership status
Age, gender, and race/ethnicity
Figure 2 displays coefficient estimates with 95% confidence intervals:
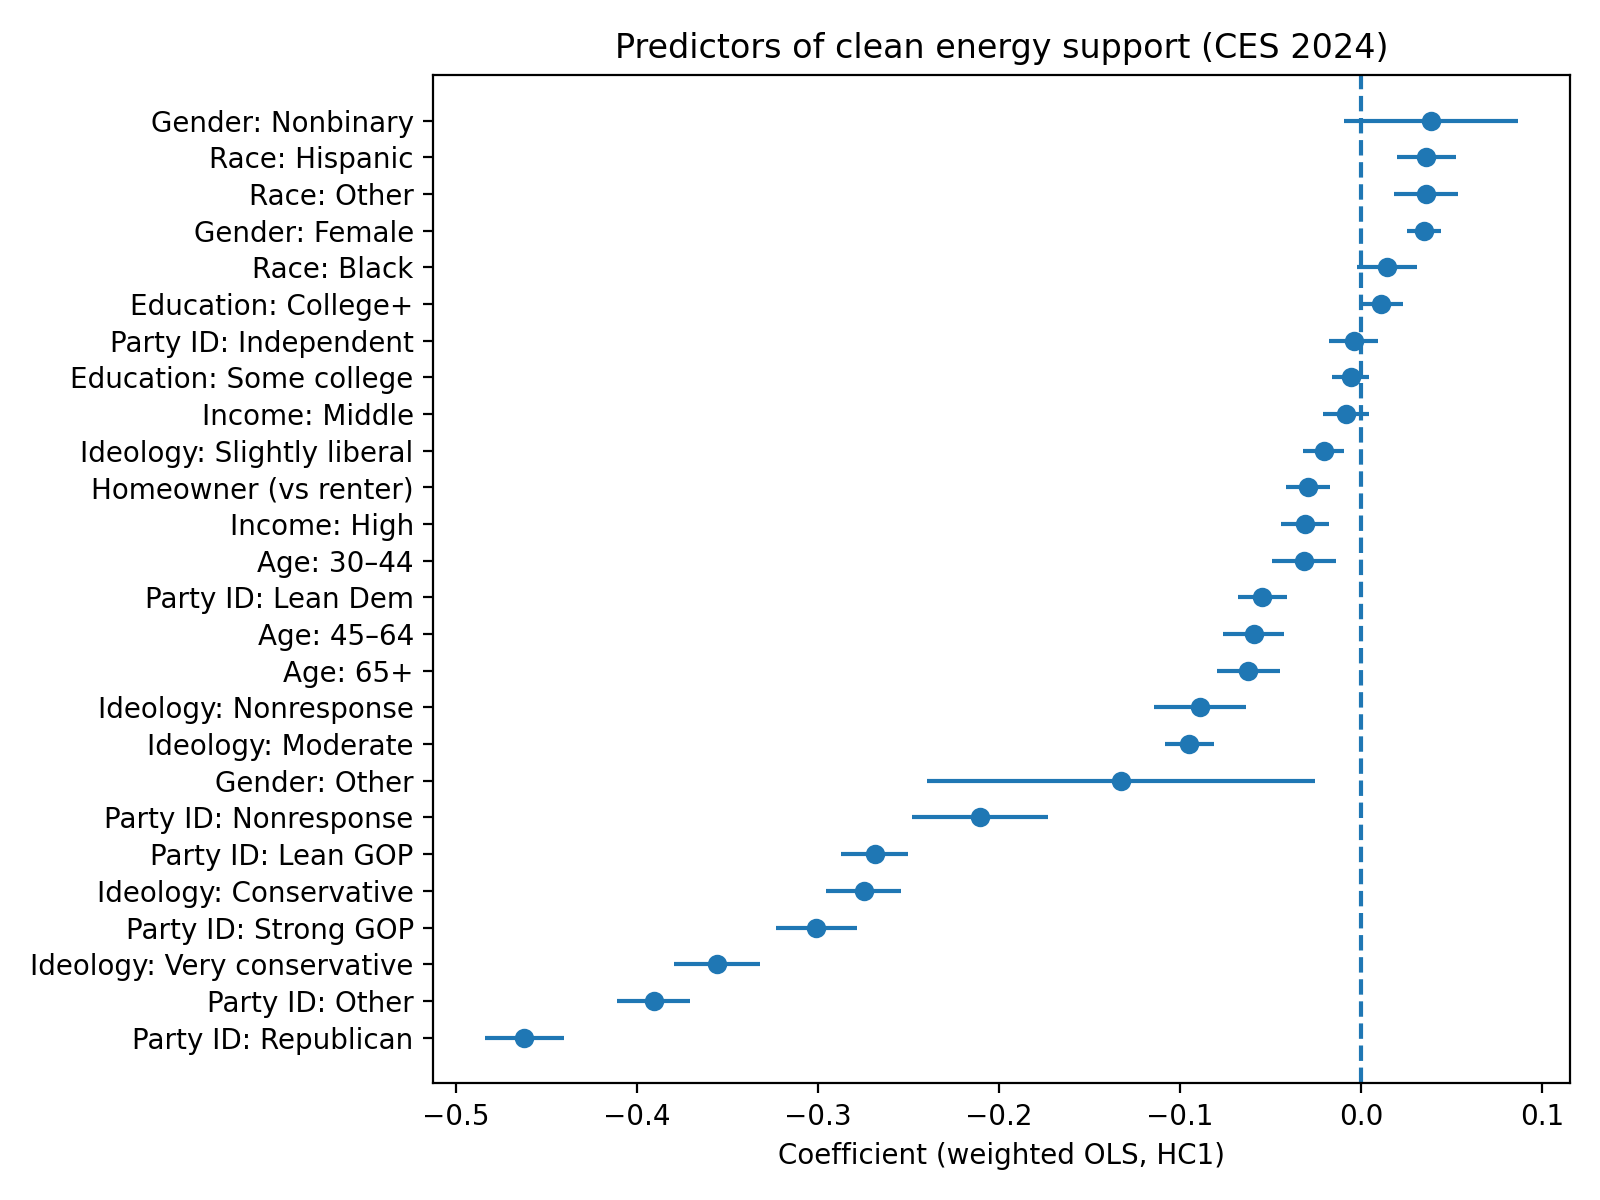
As expected, party identification and ideology are the strongest predictors of clean energy support. Moving from liberal to conservative ideological categories is associated with large declines in support, and partisan differences are substantial.
However, even after accounting for these political variables, homeownership remains negatively associated with clean energy support. The estimated effect is modest in magnitude (approximately −0.03 on a 0–1 scale), but statistically significant and comparable to—or larger than—the effect of moving between income categories.
To facilitate interpretation, Table 1 presents a labeled regression table with human-readable predictor names:
| Block | Predictor | Coef (HC1) | 95% CI |
|---|---|---|---|
| Class: Income / Education / Tenure | Income: High | -0.030700 | [-0.0441, -0.0174] |
| Class: Income / Education / Tenure | Homeowner (vs renter) | -0.029300 | [-0.0415, -0.0170] |
| Class: Income / Education / Tenure | Income: Middle | -0.008400 | [-0.0211, 0.0043] |
| Class: Income / Education / Tenure | Education: Some college | -0.005700 | [-0.0162, 0.0047] |
| Class: Income / Education / Tenure | Education: College+ | 0.011100 | [-0.0012, 0.0233] |
| Demographics | Gender: Other | -0.132500 | [-0.2397, -0.0253] |
| Demographics | Age: 65+ | -0.062100 | [-0.0796, -0.0447] |
| Demographics | Age: 45–64 | -0.059300 | [-0.0762, -0.0423] |
| Demographics | Age: 30–44 | -0.031400 | [-0.0489, -0.0139] |
| Demographics | Race: Black | 0.014300 | [-0.0024, 0.0311] |
| Demographics | Gender: Female | 0.034800 | [0.0255, 0.0442] |
| Demographics | Race: Other | 0.036000 | [0.0183, 0.0537] |
| Demographics | Race: Hispanic | 0.036100 | [0.0197, 0.0525] |
| Demographics | Gender: Nonbinary | 0.038900 | [-0.0091, 0.0870] |
| Politics: Ideology | Ideology: Very conservative | -0.356000 | [-0.3798, -0.3322] |
| Politics: Ideology | Ideology: Conservative | -0.274800 | [-0.2957, -0.2539] |
| Politics: Ideology | Ideology: Moderate | -0.094900 | [-0.1084, -0.0813] |
| Politics: Ideology | Ideology: Nonresponse | -0.088800 | [-0.1144, -0.0633] |
| Politics: Ideology | Ideology: Slightly liberal | -0.020600 | [-0.0320, -0.0092] |
| Politics: Party ID | Party ID: Republican | -0.462300 | [-0.4840, -0.4405] |
| Politics: Party ID | Party ID: Other | -0.390800 | [-0.4110, -0.3706] |
| Politics: Party ID | Party ID: Strong GOP | -0.300900 | [-0.3231, -0.2786] |
| Politics: Party ID | Party ID: Lean GOP | -0.268700 | [-0.2873, -0.2500] |
| Politics: Party ID | Party ID: Nonresponse | -0.210500 | [-0.2481, -0.1730] |
| Politics: Party ID | Party ID: Lean Dem | -0.054400 | [-0.0679, -0.0409] |
| Politics: Party ID | Party ID: Independent | -0.004000 | [-0.0177, 0.0096] |
From the above we observe three clear findings:
High income is weakly associated with lower support, while middle income shows little difference relative to low income.
Education effects are small once political orientation is controlled.
The homeowner coefficient remains negative net of all controls.
These results indicate that housing tenure captures something distinct from income and ideology, likely related to asset ownership, exposure to energy costs, or perceived regulatory risk.
Predicted Values: Visualizing the Tenure Gap
To make these results more intuitive, Figure 3 plots predicted levels of clean energy support across the ideological spectrum, holding other covariates constant:
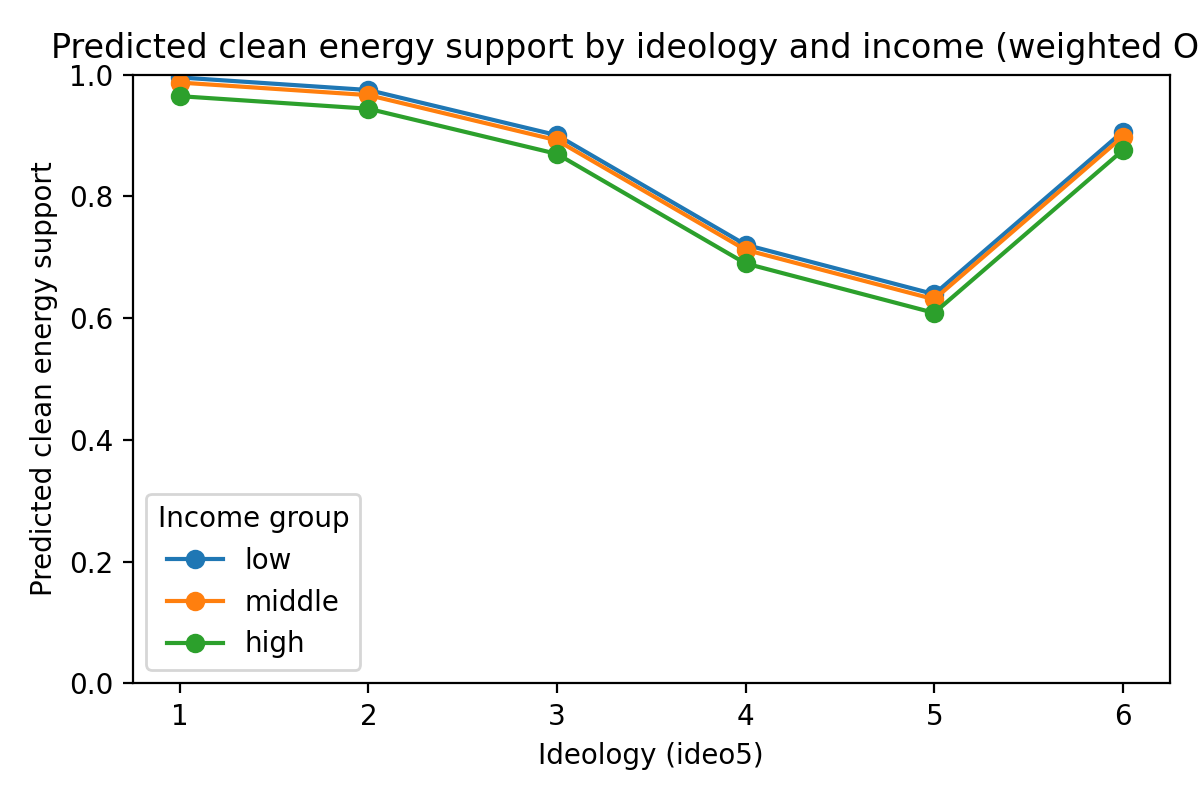
This plot of predicted values suggests that:
Ideology strongly structures climate attitudes, with steep declines from liberal to conservative positions.
Income differences are modest at most ideological levels.
Homeownership shifts the entire prediction curve downward, indicating lower support across ideological positions.
In other words, homeowners are less supportive of clean energy policies even when they share similar ideological positions with renters.
Interpretation and Implications
Taken together, these findings suggest that support for clean energy policy is shaped not only by ideology and partisanship, but also by material position within the housing system. Homeownership appears to be associated with lower support for environmental regulation in ways not reducible to income or political identity.
One plausible interpretation is that homeowners face different perceived costs and risks from climate and energy regulation, including concerns about housing retrofits, energy prices, or property values. While the CES cannot directly test these mechanisms, the results point to the importance of considering tenure and asset exposure when analyzing public opinion on climate policy.
More broadly, this analysis demonstrates that survey data—often criticized for capturing only “attitudes”—can still be used to study structured differences linked to social position, especially when variables are interpreted relationally rather than as isolated preferences.
Limitations and Next Steps
This analysis is descriptive and cross-sectional. Causal interpretations should be avoided. Additionally, the clean energy support index weights all component items equally, which may obscure policy-specific dynamics.
Future work could:
Examine individual policy items as robustness checks
Incorporate geographic context or energy cost measures
Explore longitudinal changes in tenure and climate attitudes
Nonetheless, the present results provide clear evidence that housing tenure is an underappreciated dimension of class relevant to climate politics.
Methods
View the repo for this project on my GitHub
To reproduce:
run all DuckDB SQL scripts in sql/ folder
run notebooks/01_analysis.ipynb
run report/brief.ipynb
For additional details on methods, run notebooks/03_methods_appendix.ipynb
Brady Kennedy