Re-Measuring Speculation, Evictions, and Building Conditions in NYC’s Rent-Regulated Housing
Introduction
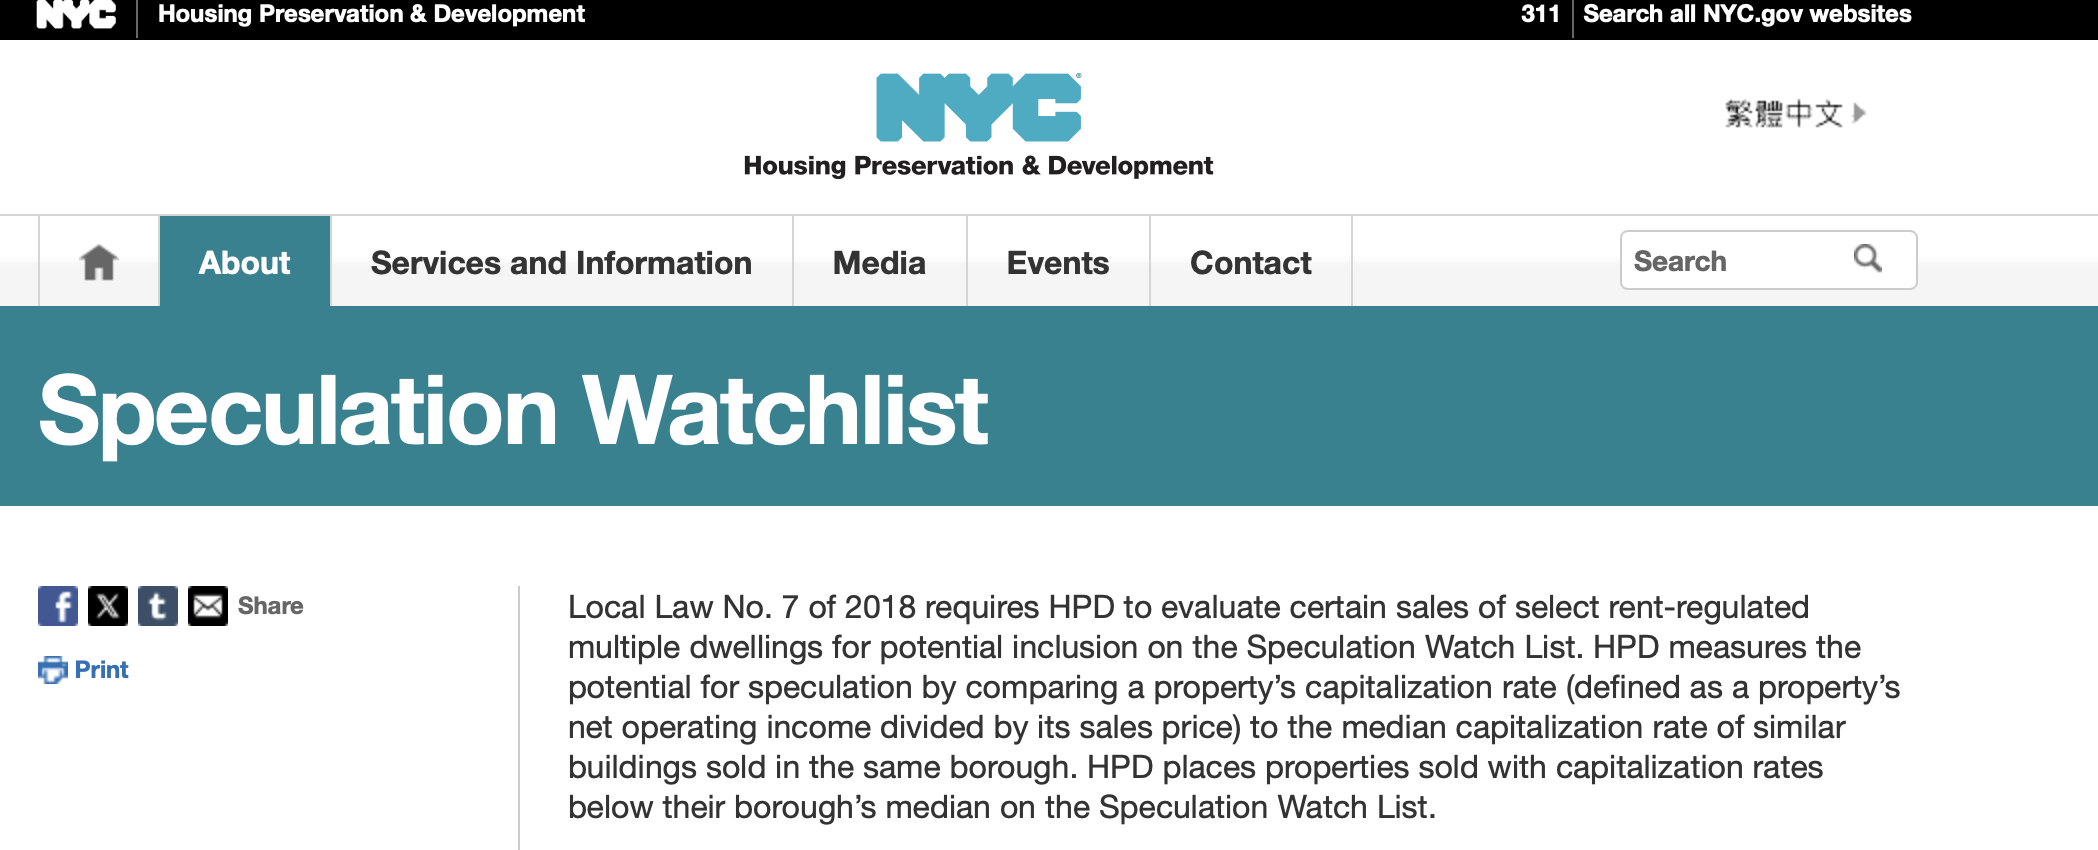
This policy brief evaluates whether New York City’s Speculation Watchlist (SWL) successfully identifies purchases of rent-regulated buildings that are followed by worse outcomes for tenants and whether the methodology can be improved using data the city already collects.
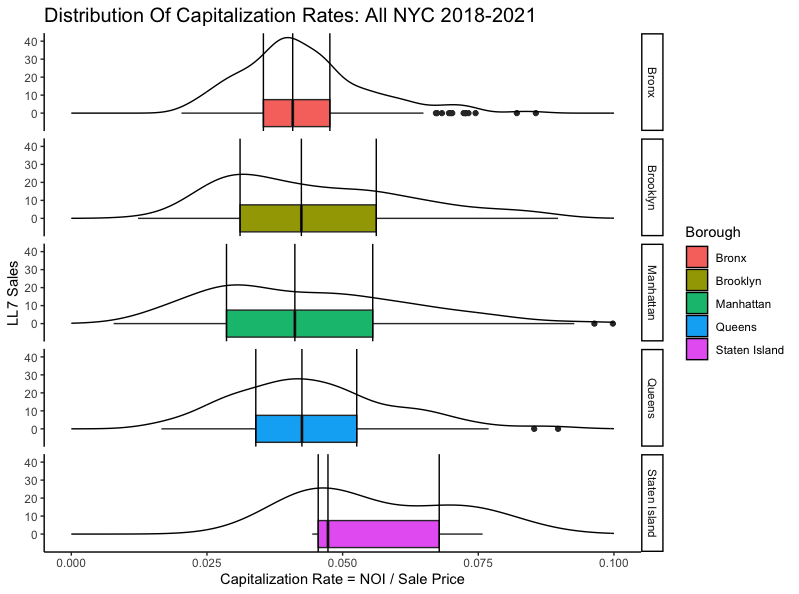
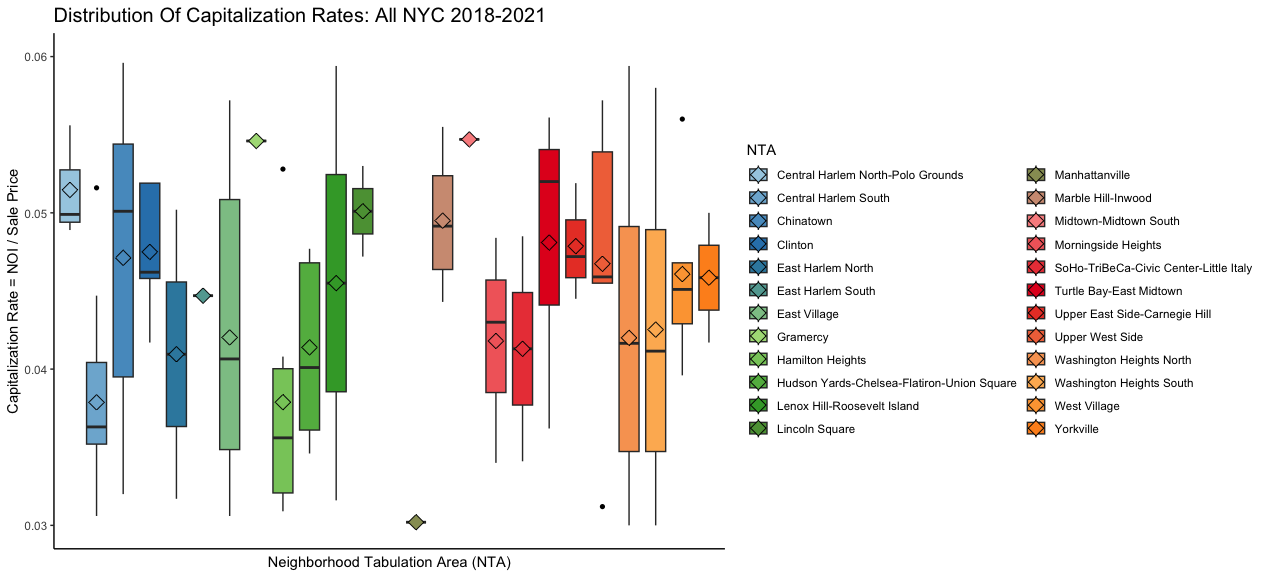
Descriptive analysis reveals that capitalization rates across NYC show substantial within-borough variation, with distributions often clustering near the lower quartile and varying sharply across neighborhoods. This suggests that a borough-level threshold may be too blunt to capture genuinely speculative behavior.
I therefore deploy a causal inference (DiD) approach to compare the official SWL definition to an alternative, neighborhood-relative (NTA-level) approach. The intuition behind this alternative appraoch posits that nusually low cap rates are more meaningful when evaluated against local market conditions rather than citywide or borough wide averages.
Below I compare two methods for identifying potential speculative behavior in the rent-regulated market:
The official HPD Speculation Watchlist (SWL), which uses borough-level capitalization rate thresholds at the time of sale.
An alternative NTA-based threshold, which flags buildings with relatively low capitalizations rates given the respective neighborhood (NTA) and quarter, a more local measure of unusually low returns on building purchases.
For each definition, I estimate how a suspected speculative purchase affects:
The number of executed evictions in the building.
The number of HPD housing maintenance code violations (all classes).
All models are estimated using Sun & Abraham’s (2020) heterogeneous treatment event-study DiD framework with building-level and year-level fixed effects (see the methodological appendix for additional notes).
Analysis
Model Summary Tables
These tables report interaction-weighted average treatment effects on the treated (ATTs) following Sun & Abraham (2020), with standard errors clustered at the building (BBL) level. Each event study model is run with the independent variable as an indicator of possible speculation with a quarterly capitalization rate threshold of 50th percentile, 25th percentile, and 10th percentile.
Evictions
Official SWL (Borough-Level) Methodology
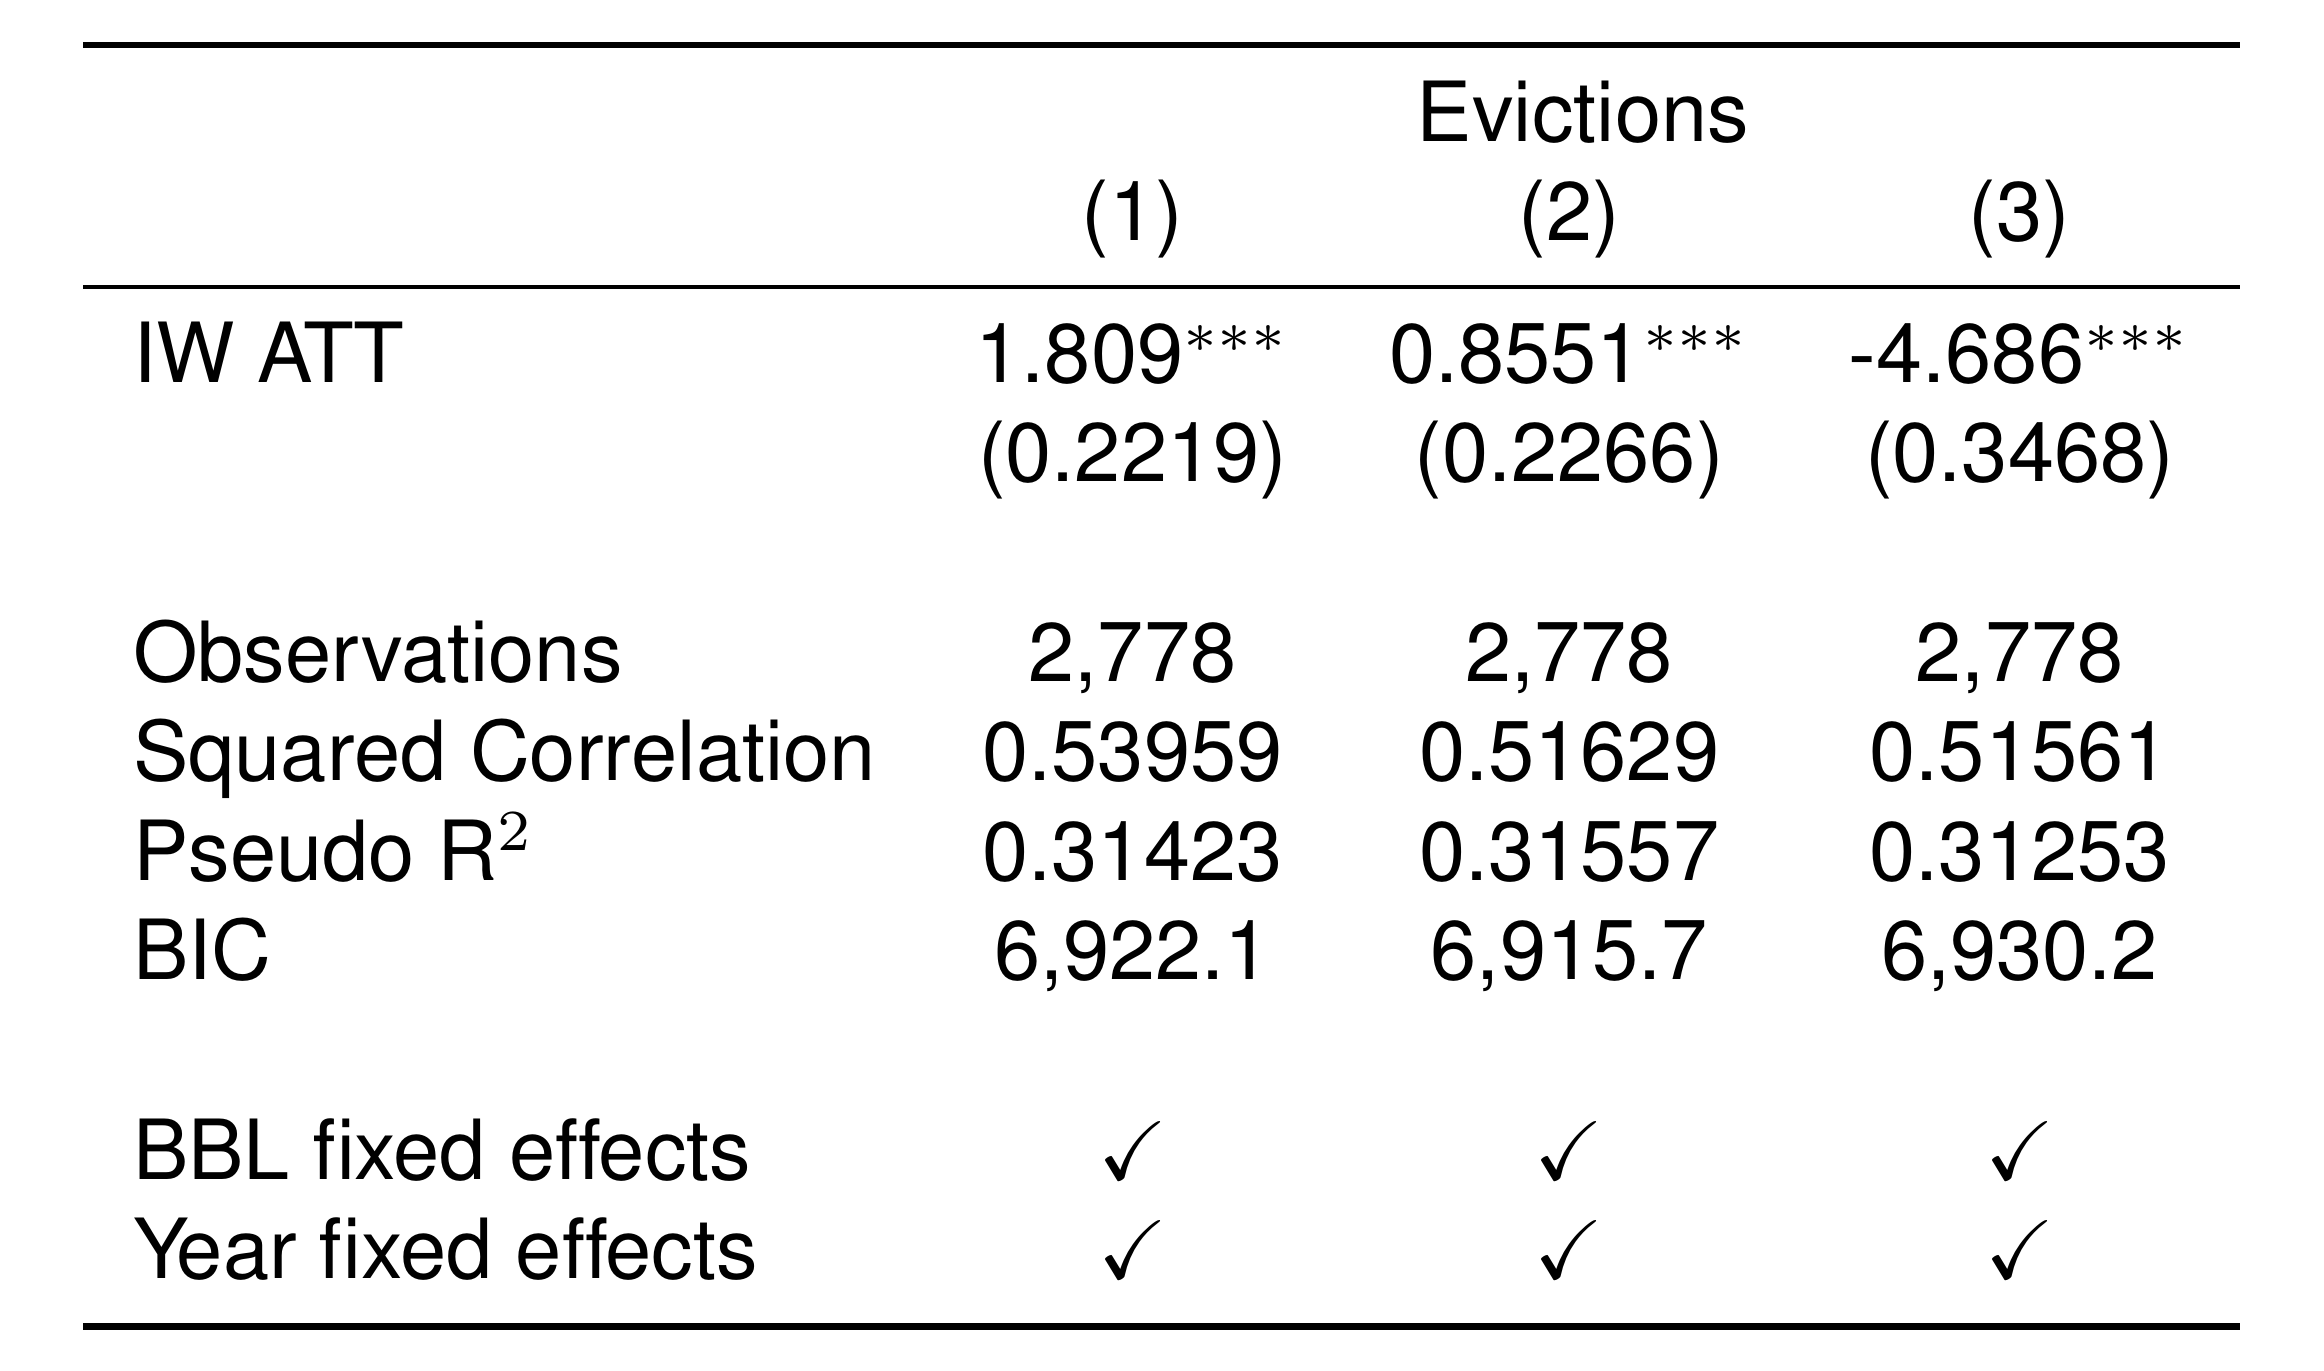
The coefficients on the interaction-weighted average treatment effect on the treated (IWATT) for all models are significant and model fit is similar across models. However, in Model 1 and Model 2, the effect is strong and positive, indicating a relatively greater level of evictions in buildings with suspected speculative sales, while in Model 3 the coefficient flipsnegative. Though the change in the sign in the coefficient may be due to the relatively smaller proportion of treated units in the third model, these results at present must be interpreted as presenting an ambiguous relationship between real estate speculation as identified by relative capitalization rate at the borough level and the number of evictions in periods following a potentially speculative purchase.
NTA-Level Methodology
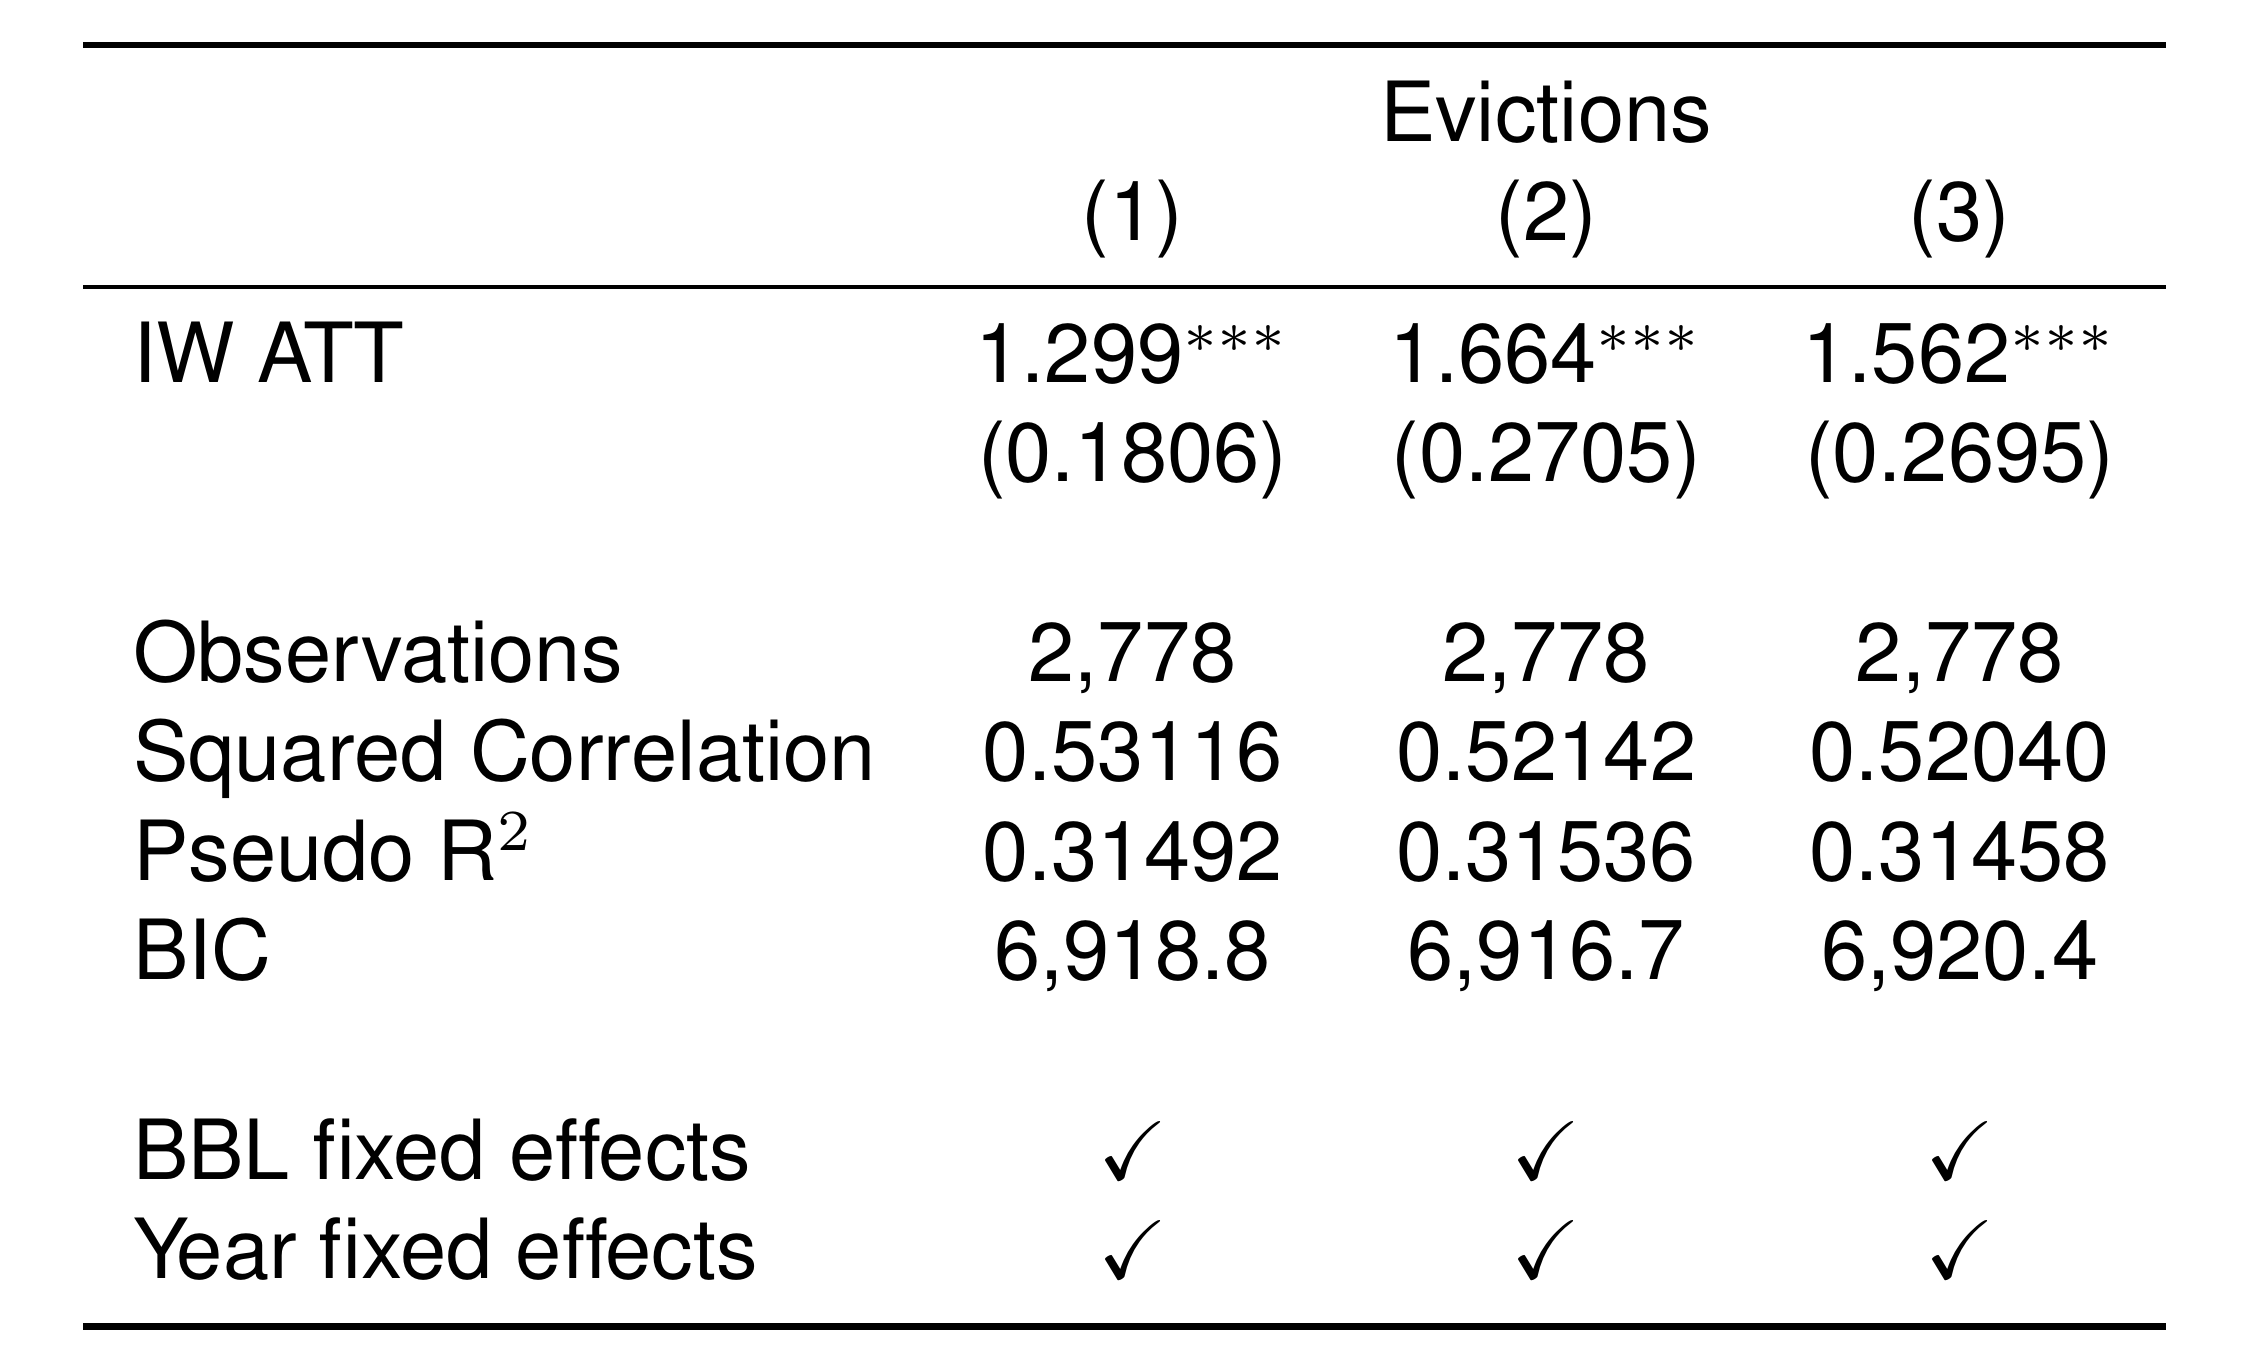
When repeating the above analysis at the NTA level, all coefficients are positive and model fit is similarly strong across models. These results suggest a strong relationship between a relatively low capitalization rate at time of purchase when measured at the neighborhood level and an annual increase in the number of evictions at the purchased property in years following the sale, with a 25% cutoff in capitalization rates producing the most sensitive response.
HPD Violations
Official SWL (Borough-Level) Methodology
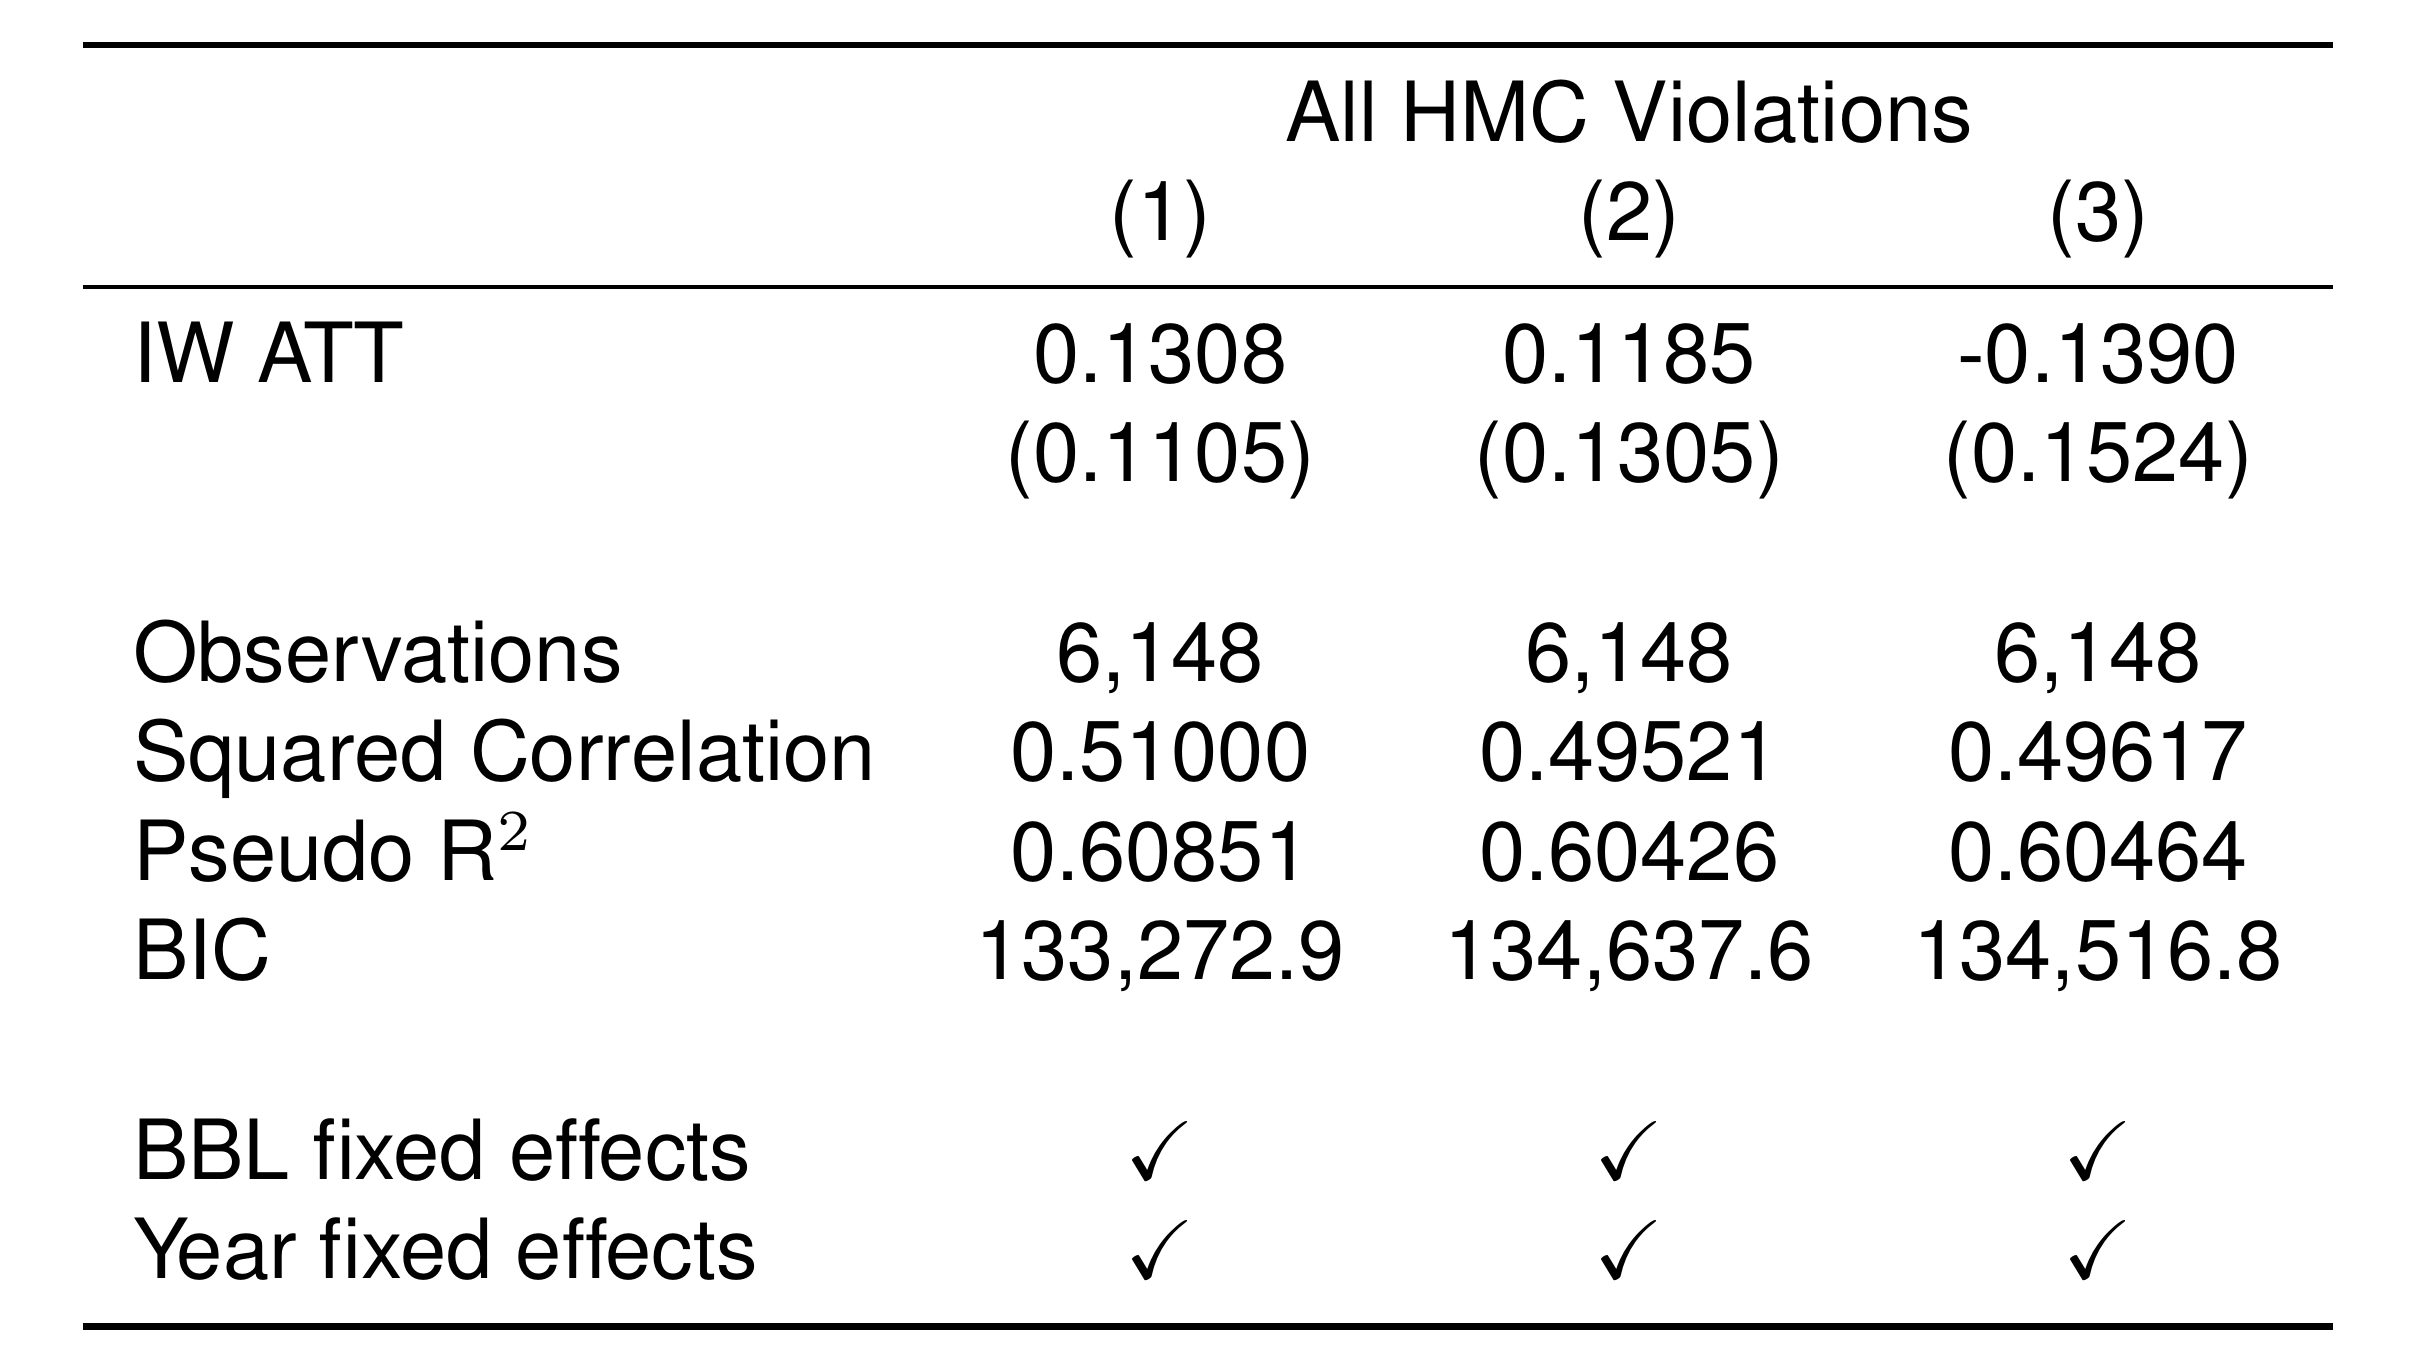
There appears to be no significant relationship between the number of HPD violations and a building’s status according to these three watchlist specifications when the official SWL (borough-level) speculative sale indicator criteria is applied.
NTA-Level Methodology
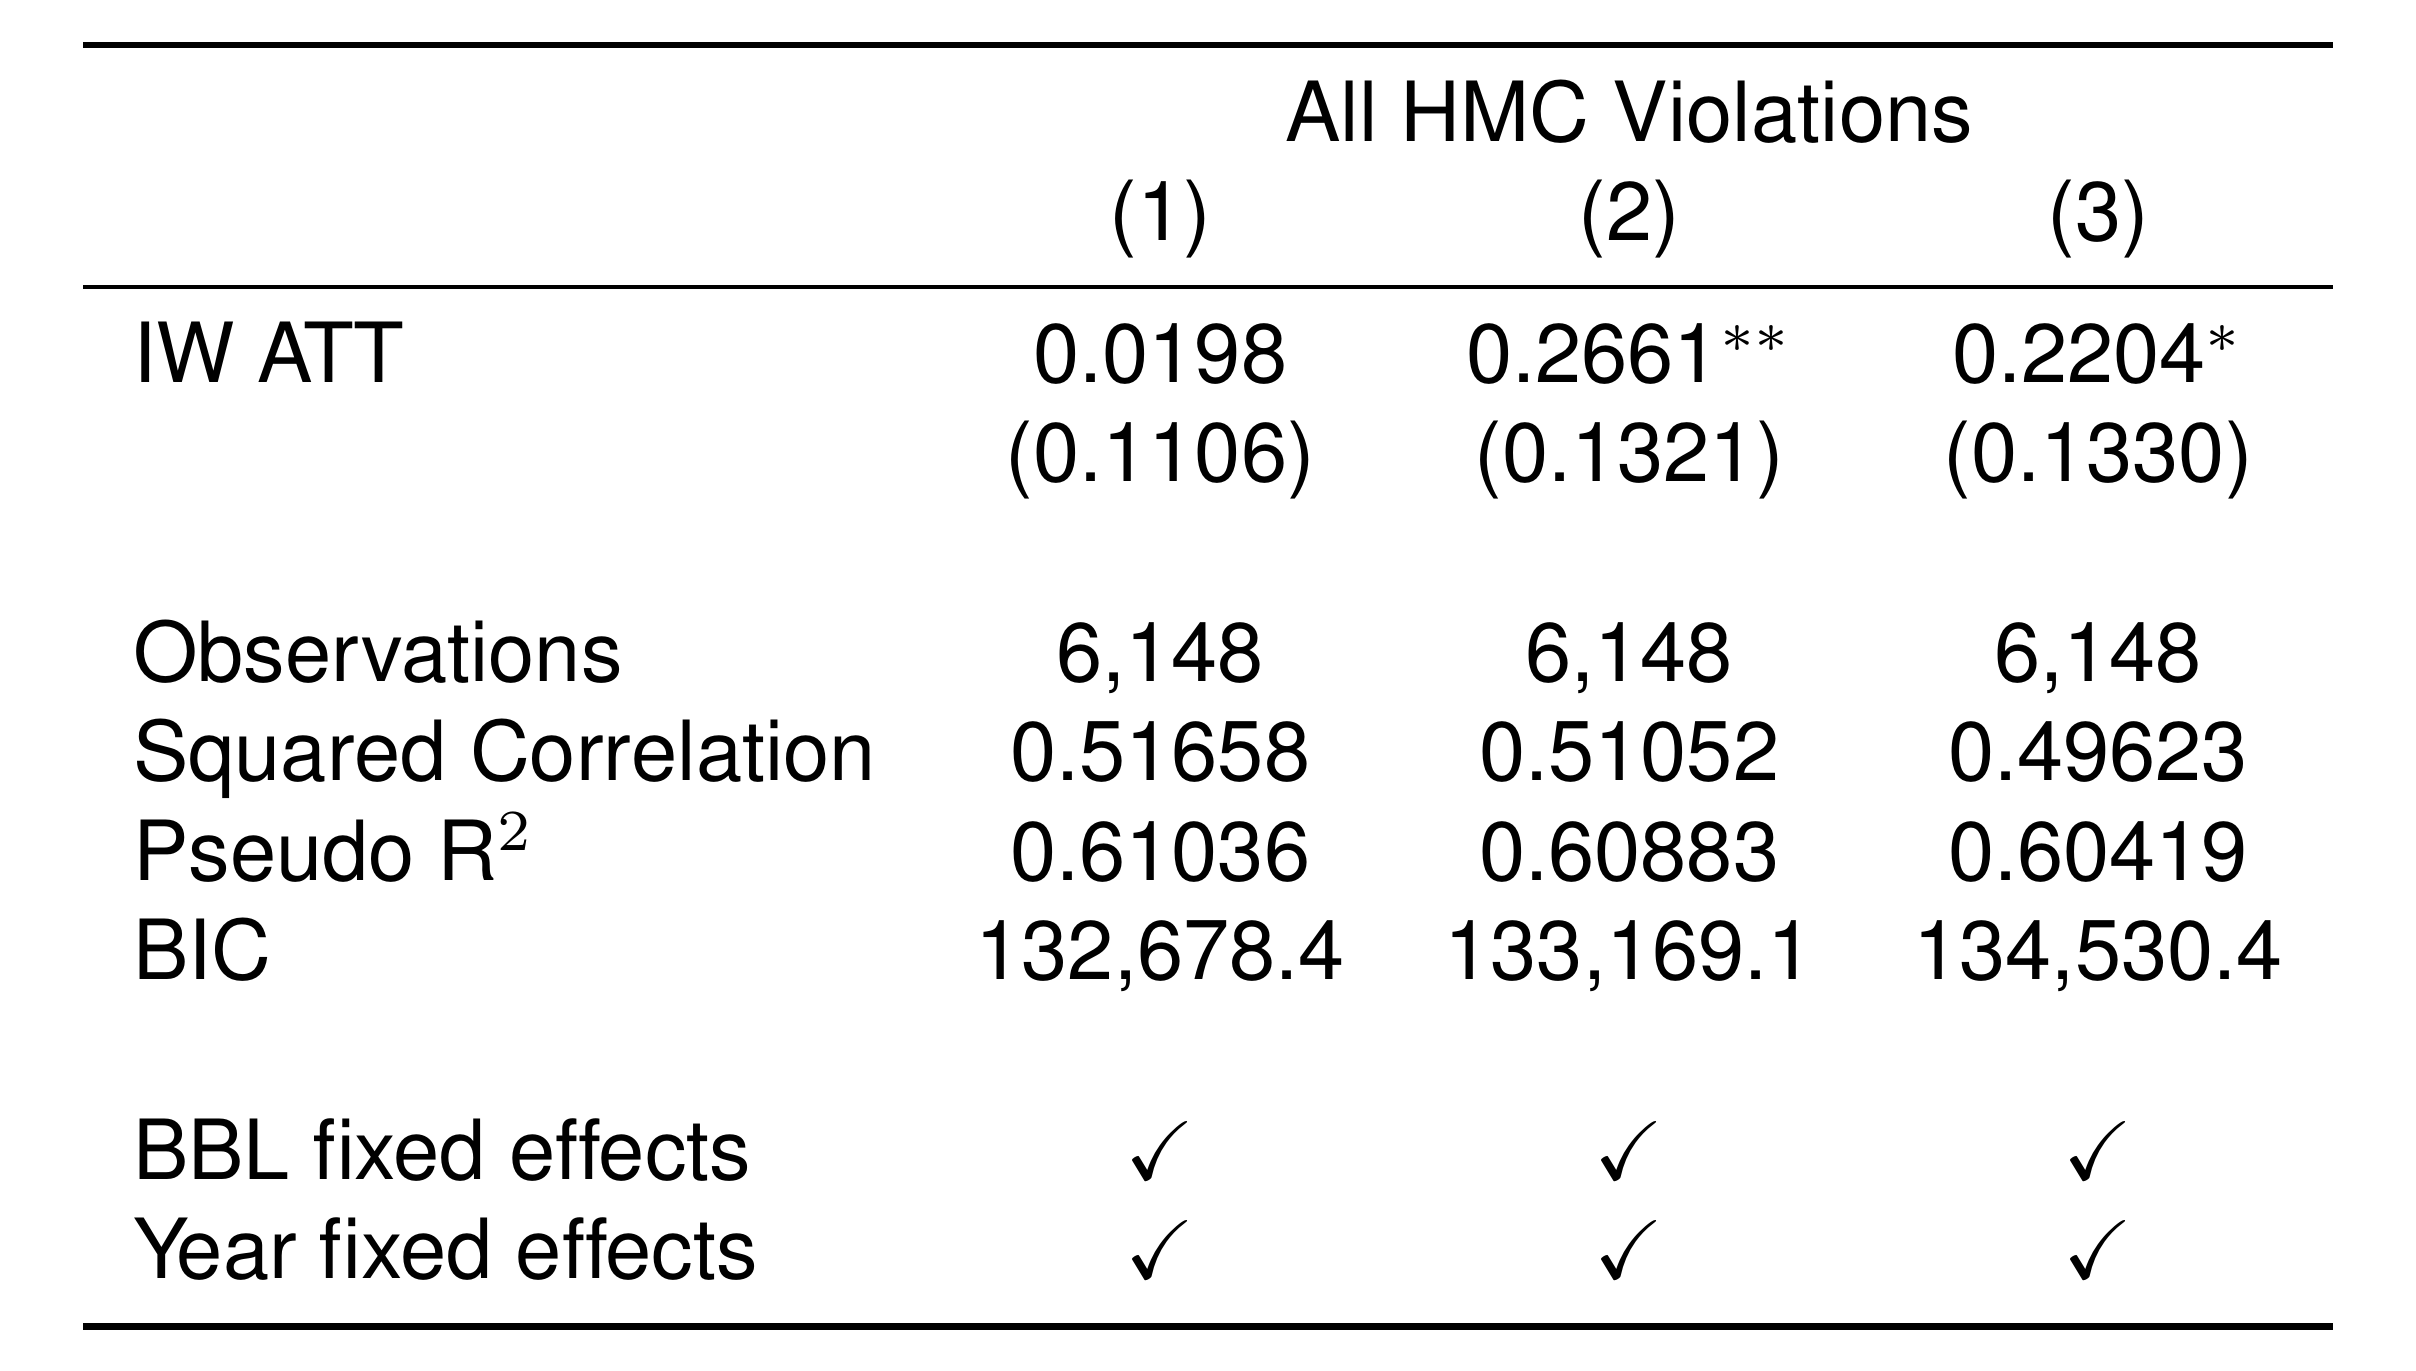
Alternatively setting the threshold at the NTA’s quarterly bottom 25th percentile of capitalization rates leads to a stronger level of statistical significance and improves model fit overall. Applying a capitalization rate based speculation indicator at the NTA level appears overall more sensitive regardless of the cutoff rate selected.
Event-study Plots
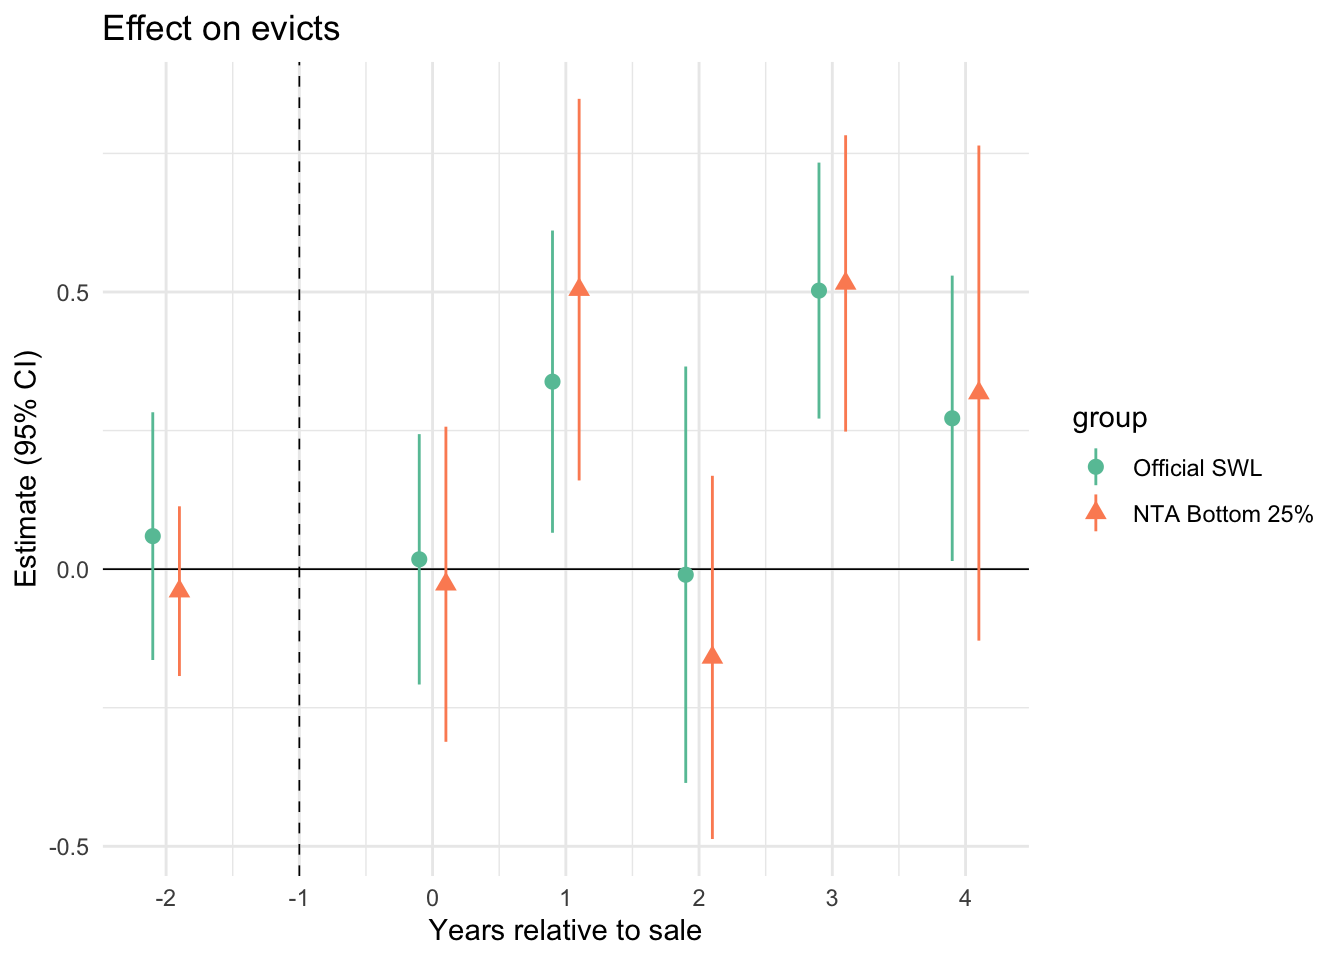
Given the results of the models, in the full event study plots below I directly compare the official SWL methodology with the most sensitive method according to the results: NTA-based with a cap rate threshold of 25%.
Evictions
HPD Violations
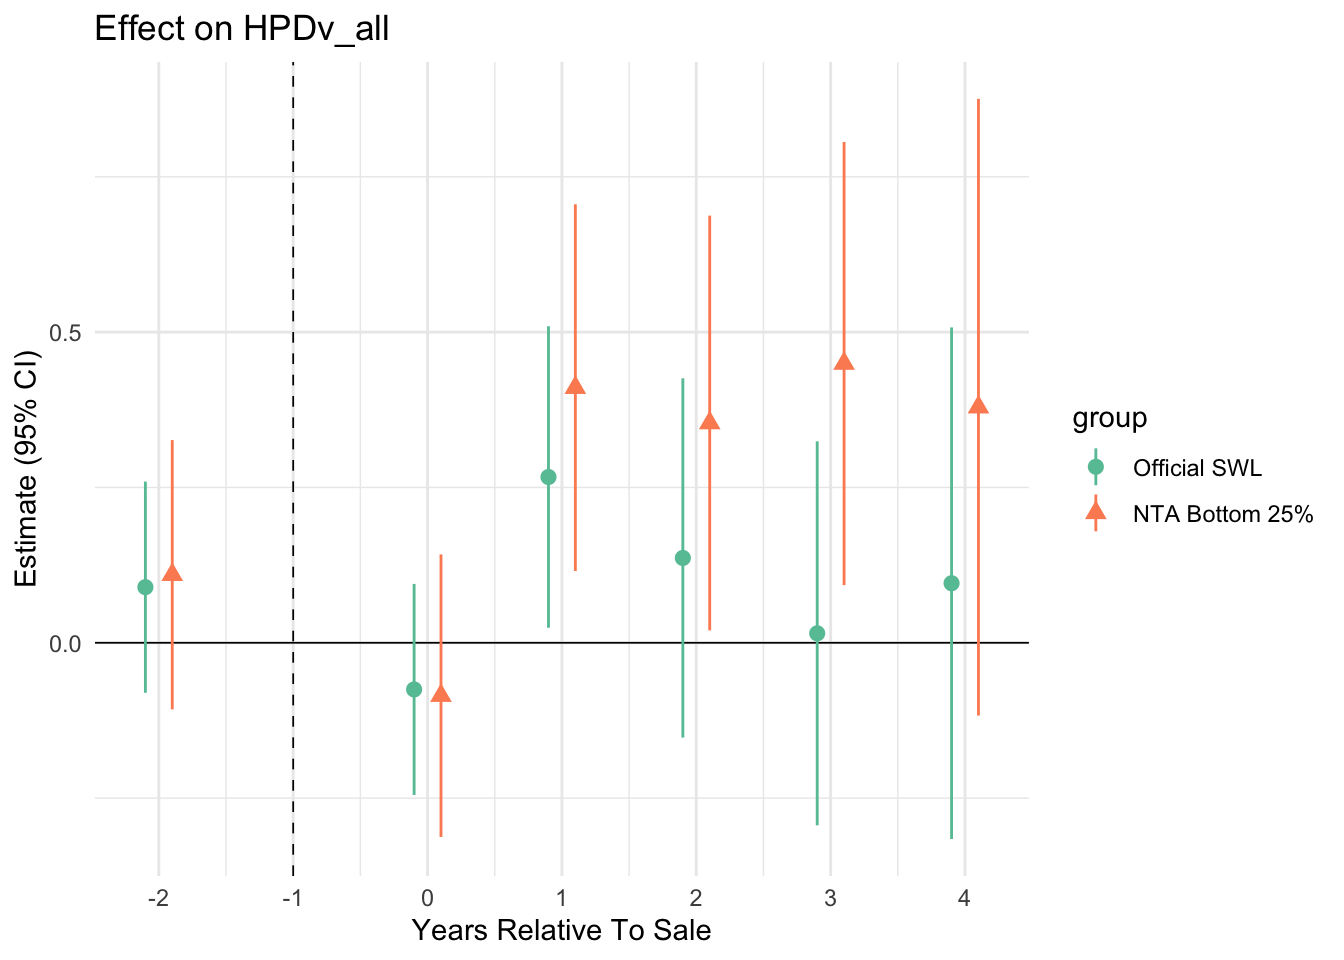
Speculative acquisitions of rent-regulated buildings appear to be followed by sustained increases in eviction activity and increases in HPD violations. These effects are stronger when speculation is identified using a neighborhood-relative (NTA bottom-quartile) capitalization rate threshold, suggesting that this more local benchmarks is more sensitive to speculative behavior than the official borough-level Speculation Watchlist.
Summary
In all models, the interaction-weighted treatment effects are positive, indicating that:
Buildings flagged as speculative subsequently experience higher eviction counts compared to similar rent-regulated buildings that were not flagged.
The number of HPD housing maintenance code violations also increases following a speculative purchase.
The NTA bottom 25% criterion tends to yield larger and more precisely estimated treatment effects, suggesting that a neighborhood-specific measure of unusually low cap rates is more sensitive to genuine speculative activity than the broader, borough-wide threshold used in the official Speculation Watchlist.
Policy Implications
Speculative purchases matter for tenant outcomes. Both eviction counts and code violations rise following a low-cap-rate purchase of a rent-regulated building.
Neighborhood-based thresholds outperform borough-wide ones. Using the bottom 25% of cap rates within an NTA and quarter produces stronger and more stable relationships with negative tenant outcomes, while keeping the watchlist targeted.
Policy implication: HPD could improve its Speculation Watchlist by:
Computing cap-rate thresholds at the NTA (neighborhood) level, and
Prioritizing buildings in the lowest quartile of cap rates for inspections, enforcement, and preservation interventions.
Brady Kennedy